SmartPM Admin Interface
Tools
Sketch App
Techniques
Customer Discovery, Information Architecture
Process
Who was the client?
SmartPM is a software-as-a-service that helps property owners predict delays in their construction projects. Mike Pink, the Co-Founder of SmartPM, had built a powerful, feature-rich platform for predicting delays in construction projects. It could comb through project schedules with thousands of interlocking activities and detect subtle problems before they surfaced as delays.
Why did they need my help?
Construction projects are massively collaborative. Hundreds of contractors, subcontractors, and suppliers have to coordinate thousands of activities. While small mishaps typically go unnoticed, they quickly snowball into bigger setbacks. SmartPM was meant to help industry professionals target the mishaps that mattered, before they turned into delays.
Mike was looking for a way to express the health of a construction project as a set of vital signs that were familiar to people in the construction industry. He also needed a way to compare several projects to each-other from a high-level perspective. He needed a dashboard.
A dashboard would visualize the signs of delay before it was too late. It would also be a huge upgrade from the spreadsheets that Mike’s prospective customers were used to. This would make it possible for Mike to pitch SmartPM to construction professionals who didn’t have time to run the numbers.
How did I help them?
The project started by performing a precursory data analysis SmartPM’s data collection, looking for the most compelling data points. That’s how the four categories of data that summarized the relative health of each portfolio project were determined. They are as follows:
total projects delayed
total projects with poor schedule quality
total projects
total projects on track
In addition, the dashboard incorporated six indicators that described how each project’s health changed over time:
planned progress
actual progress
schedule quality
delay to date
schedule compression
schedule criticality
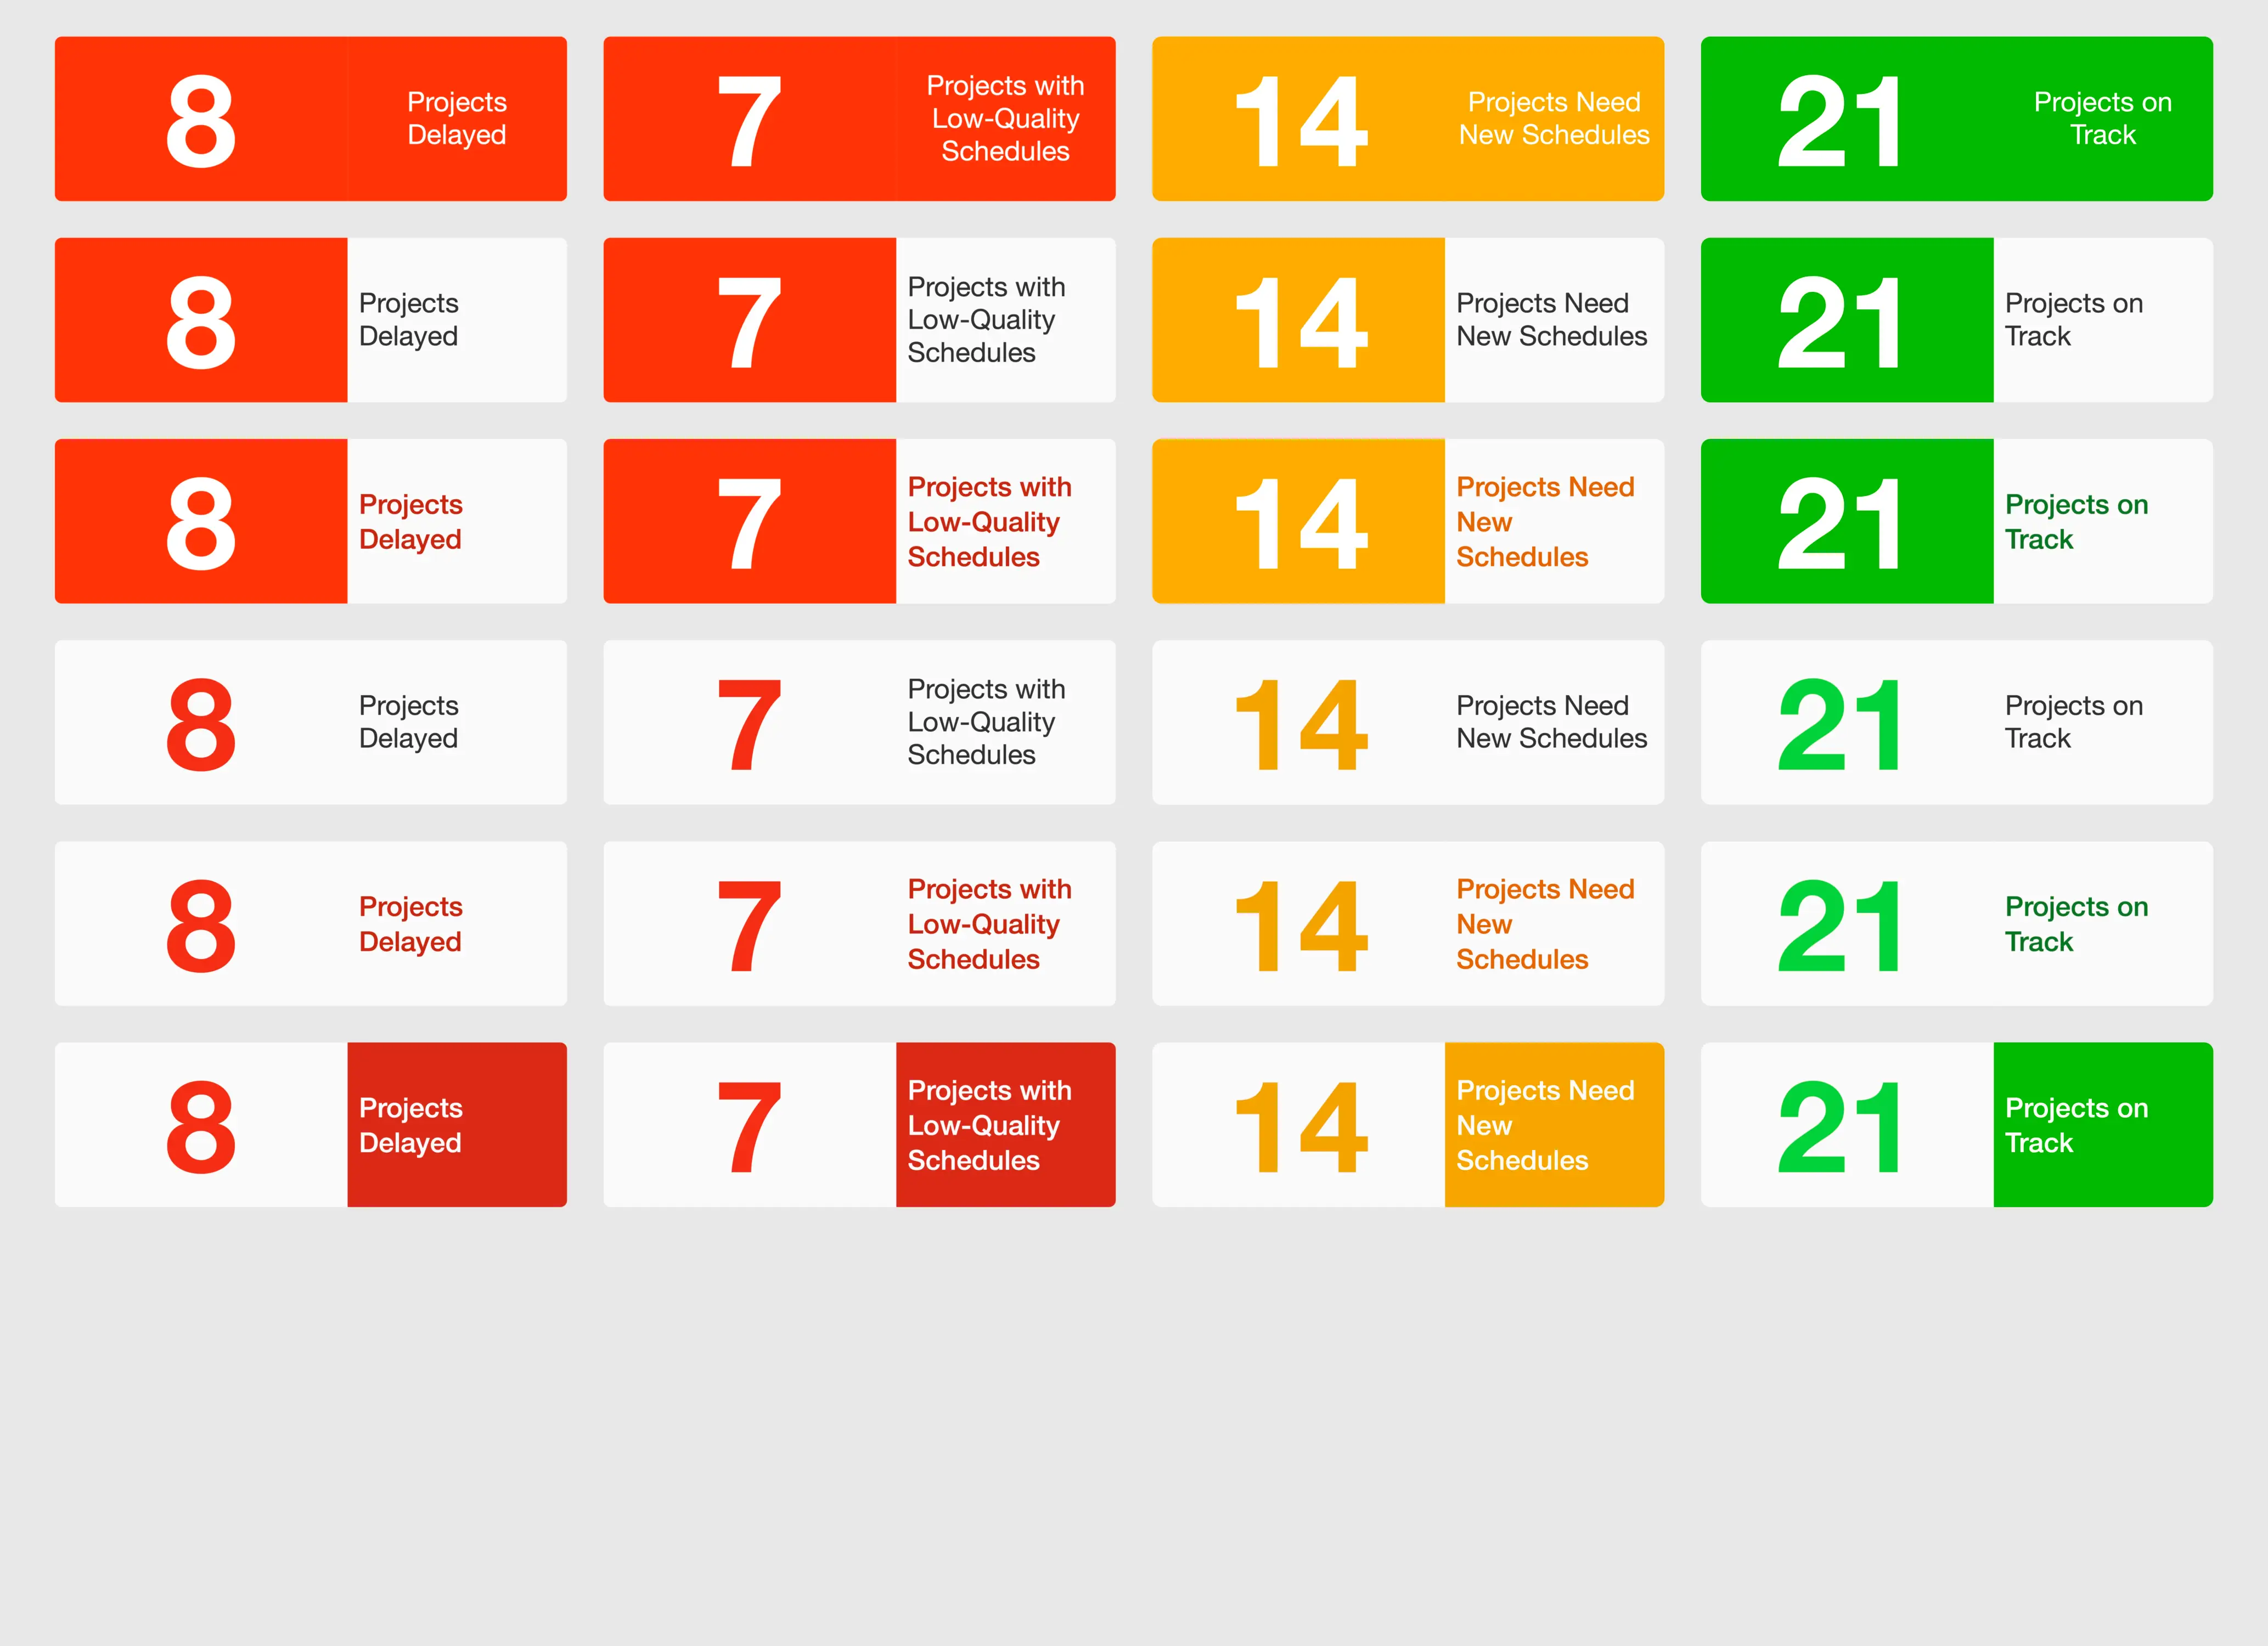
Next, a style guide documented the design rules of the dashboard. Included were a handful of wireframes, spark lines, graphs, gauges, maps and badges. They grouped together into a summary section, and a list of projects. The summary reflected the overall health of the portfolio. Each list item reflected the health of a specific project. The style guide used simple red, yellow and green badges to label different levels of priority and urgency.
The color-coded dashboard design harnessed the power of preattentive processing. Preattentive processing is our minds’ tendency to assemble colors, shapes, arrangements and motion into things - before we even know what those things are.
What were the results?
It became effortless for viewers to spot outliers, infer causality, and predict change in the dashboard’s graphics. SmartPM saved one of their first customers $700,000 in costs associated with delays. Construction professionals and investors alike began to take notice. Not long after, Mike was able to close a $1.1 million dollar round of seed funding.
Those are the kind of results that speak for themselves.